All tests of historical strategy performance (“backtests”) are imperfect reflections of the future. No one can say with certainty how stocks, bonds and other asset classes will perform in the coming years, but we have to root our analysis in something, and past performance is usually the best proxy.
There’s a huge chunk of the market however that we do know, with certainty, will underperform the norms of the last four decades: government bonds and other assets that are primarily driven by interest rates. That’s not prognostication, it’s a mathematical certainty.
If we know that these assets will underperform, then using straight historical data in our backtests paints an inaccurate picture of the future. All backtests are imperfect, but using data we know to be too optimistic is just plain wrong.
The fix: “currentizing” historical bond returns
At BetterBuyAndHold we solve this problem by building portfolios using “currentized” bond returns. Things get a bit technical from here, but in a nutshell, we deconstruct each bond asset’s history into all of the constituent factors that drive returns. We then assume that the largest driver of bond returns, the current yield, was never higher than it stands today. Learn more.
This currentizing process means that our results will slowly change over time as yields change.
Currentizing 16 popular buy & hold strategies
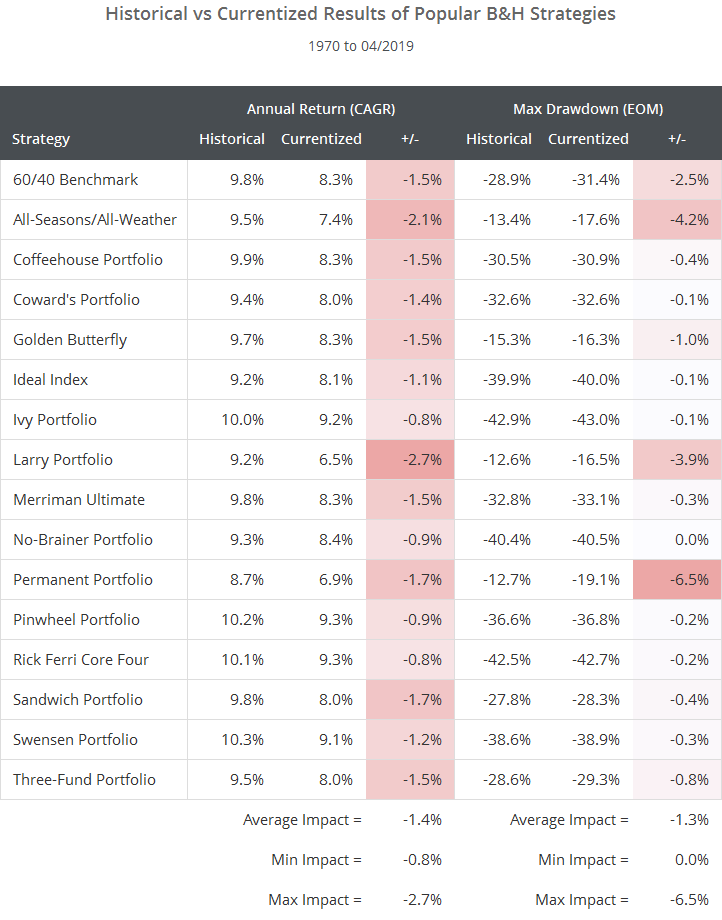
To understand the significance of bad bond data, we put 16 popular buy & hold strategies to the test, and show the impact that currentized bond returns had on each strategy’s annual return and max drawdown (see backtest assumptions).
We’ve used Portfolio Charts as our reference for defining the asset classes held by each strategy. We’ve included all but one of the portfolios found on their site.
Most strategies saw at least a 10-20% reduction in annual return, and some saw a significant increase in max drawdown. All told, the biggest losers in our analysis were also some of the most popular, including the All-Seasons (aka All-Weather) Portfolio and the Permanent Portfolio.
A 10-20% reduction in return could be catastrophic from a financial planning perspective. Investing for long-term goals like retirement, and determining sustainable withdrawal rates once we get there, requires us to make assumptions about portfolio returns. Finding out that we’ve underperformed those assumptions by 10-20% is huge. A dollar that returns 10% per year for 40 years becomes $45. A dollar that returns 8% per year becomes less than half that, $21.72.
To be clear: We’re not picking on Portfolio Charts here. Nearly all buy & hold backtests suffer from this same fatal flaw. As far as conventional buy & hold analysis goes, nobody does it better than Portfolio Charts. They are to buy & hold what Allocate Smartly is to tactical asset allocation. What we’re picking on is conventional buy & hold analysis, because it’s inherently wrong.
How we use currentized results
We use currentized historical data, not straight historical data, when designing our portfolios. We know that all historical data is an imperfect proxy for the future, but we should adjust for the portion that we know to be overly optimistic.
That means that our asset allocations will slowly change over time as yields change. That’s okay. Sound buy & hold investing requires periodically rebalancing our portfolio. Those rebalances provide the opportunity to keep up with the optimal allocation. We can also adjust to the optimal allocation when we add funds (by buying assets that we’re under-allocated to) or withdraw funds (by selling assets that we’re over-allocated to).
We take our analysis a step further by using a statistical technique called “Subset Resampling” to reduce our reliance on the future looking like the past (in geek speak: to reduce “estimation error”). Even if one of the currentized portfolios shown above had performed inline with our own in the past, we would still choose to trade ours. Why? Because our use of subset resampling means our portfolios are more resilient to an uncertain future.
New here?
We invite you to learn more about our process and take our Portfolio Builder for a free test drive. Become a member for less than a $1 a week to unlock all functionality. Have questions? Please check out our FAQs or contact us.
Calculation note: We track some of these strategies at Allocate Smartly. These historical results may differ slightly from those we show on AS due to different assets traded in order to match Portfolio Charts’ site. Why don’t we use currentized data at AS? Read this (#1).
